 GlucoSpike AI
How to Read CGM Trend Arrows (And What to Do About Them)
Trend arrows on your CGM tell you where your glucose is headed and how fast. Here's exactly what each arrow means and what action to take.
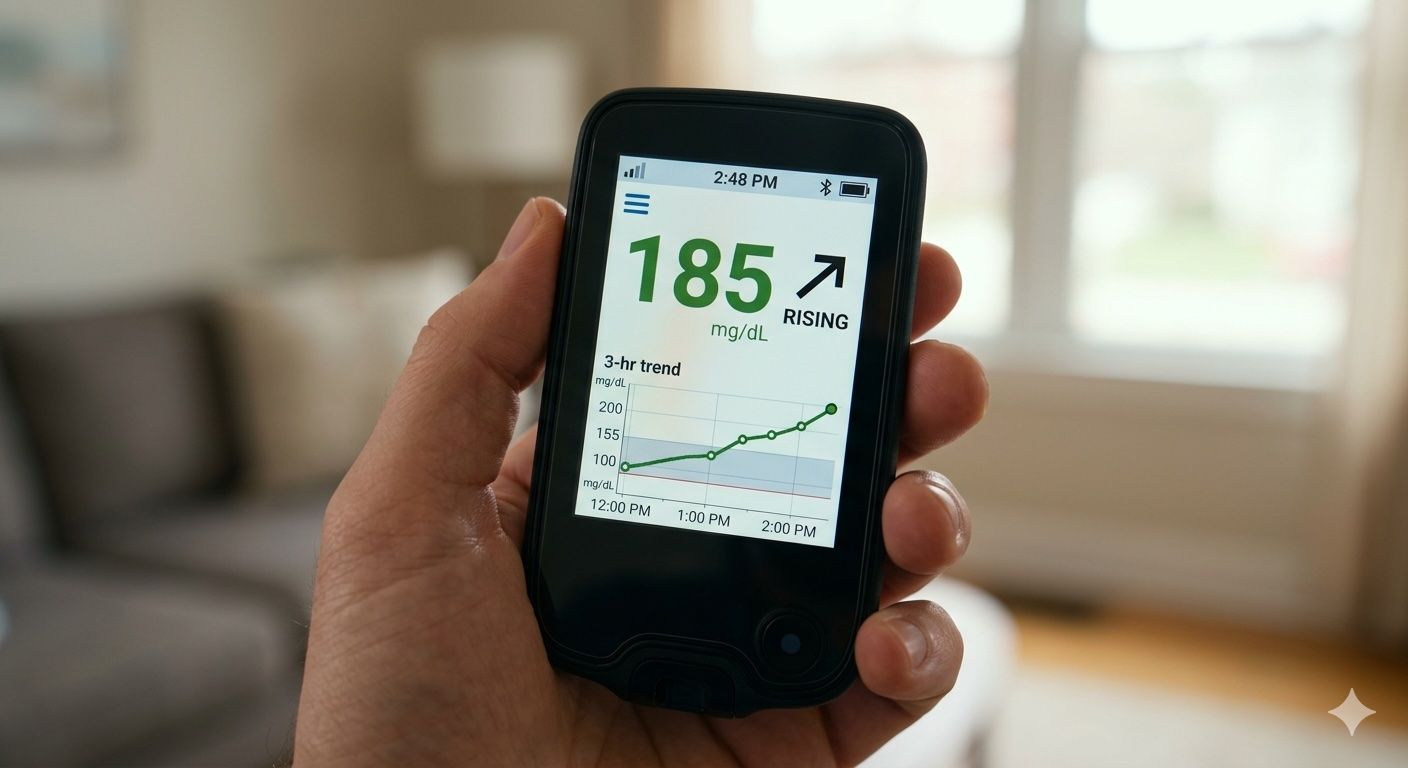
You glance at your CGM and see a number — say, 130 mg/dL. But next to it is an arrow pointing diagonally up. Is that fine? Should you be worried?
The number alone tells you where your glucose is. The arrow tells you where it's going. That second piece of information is often more important.
Here's how to read every CGM trend arrow — and what to actually do when you see each one.
What Trend Arrows Actually Measure
Trend arrows show your rate of glucose change — how many mg/dL your blood sugar is moving per minute. Most CGM systems calculate this over the last 15–20 minutes and display it as a directional arrow.
The key thresholds:
- Less than 1 mg/dL/min → Stable (flat arrow)
- 1–2 mg/dL/min → Moderate rise or fall (single diagonal arrow)
- More than 2 mg/dL/min → Rapid change (double arrows)
The Five Trend Arrows Explained
↑↑ Double Arrow Up (Rapidly Rising)
What it means: Your glucose is rising more than 2 mg/dL per minute — that's 60+ mg/dL in 30 minutes if the trend continues.
When you'll see it: Large high-carb meals, eating after a fast, stress spikes, or a missed insulin dose.
What to do: If you're not on insulin, this is the moment to take a 10-minute walk. Movement helps muscles absorb glucose and blunts the spike. Don't panic — context matters. A double-up arrow 20 minutes after a large meal is expected.
↑ Single Arrow Up (Rising)
What it means: Glucose is rising 1–2 mg/dL per minute — moderate and expected after most meals.
When you'll see it: 30–60 minutes after eating, especially higher-carb meals.
What to do: Monitor. If you're heading toward your personal high threshold, consider a short walk. For most people with prediabetes, a single up arrow after a meal is normal — the question is how high it goes and how quickly it comes back down.
→ Flat Arrow (Stable)
What it means: Glucose is changing less than 1 mg/dL per minute. Effectively stable.
When you'll see it: Fasting periods, between meals, or a few hours after eating when levels have settled.
What to do: Nothing. This is exactly what you want for most of the day.
↓ Single Arrow Down (Falling)
What it means: Glucose is dropping 1–2 mg/dL per minute.
When you'll see it: After exercise, during fasting, or as insulin kicks in.
What to do: If you're above 90 mg/dL and feeling fine, this is usually good news — your body is regulating well. If you're approaching 70 mg/dL and dropping, have a small snack ready.
↓↓ Double Arrow Down (Rapidly Falling)
What it means: Glucose is dropping more than 2 mg/dL per minute — a fast descent that could lead to hypoglycemia.
When you'll see it: Intense exercise, too much insulin, or a combination of fasting and activity.
What to do: If you're on insulin, follow your diabetes care team's protocol immediately. If you're not on insulin and are above 80 mg/dL, slow down, have a small snack, and monitor closely. Don't wait until you feel symptoms.
The Most Common Mistakes When Reading Trend Arrows
1. Treating the arrow without looking at the number
A single-up arrow at 90 mg/dL is completely different from a single-up arrow at 175 mg/dL. Always read both together.
2. Panicking at a post-meal double arrow
Glucose rises after meals. A rapid spike in the first 30–45 minutes after a large meal is expected — the question is whether it comes back to baseline within 2 hours. A double-up arrow at minute 20 doesn't mean something is wrong.
3. Ignoring a flat arrow at a high number
If your glucose has been flat at 160 mg/dL for two hours, that's more concerning than a single arrow up at 130 that's clearly declining. Sustained highs are the issue, not momentary rises.
4. Relying only on arrows without tracking meals
Arrows tell you direction. They don't tell you why. Pairing CGM data with meal logging gives you the full picture.
The Pattern That Actually Matters
The most useful thing a CGM teaches you isn't individual readings — it's the shape of your glucose curve after meals.
A well-managed meal looks like a gentle hill: a modest rise over 45–60 minutes, peaking around 130–140 mg/dL, then a gradual return to baseline within 2 hours.
A problematic meal looks like a spike: a rapid rise (double arrows) to 180+ mg/dL, followed by a sharp crash that leaves you hungry and tired.
Once you know what a good curve looks like, you start to recognize which meals create it — and which ones don't.
Don't Want to Decode Arrows All Day?
This is exactly why GlucoSpike AI exists. Instead of reading trend arrows after the fact, GlucoSpike scores your meal before or just after you eat it — giving you a 0–10 GlucoScore for likely glucose impact.
You don't need to wait for a double-up arrow to know white rice and mango juice isn't the right breakfast for your blood sugar goals. GlucoSpike tells you upfront.
No sensor. No arrows. Just a score — and the knowledge to make smarter choices.
Try GlucoSpike free for 7 days at glucospike.ai.
🥗 Get weekly blood sugar tips from GlucoSpike
Practical meal tips, glucose-friendly recipes, and app updates — straight to your inbox. No spam.